With Canvas Analytics, instructors can evaluate individual components of the course and students’ performance. The analytics can be viewed easily on the Canvas course website and is used to:
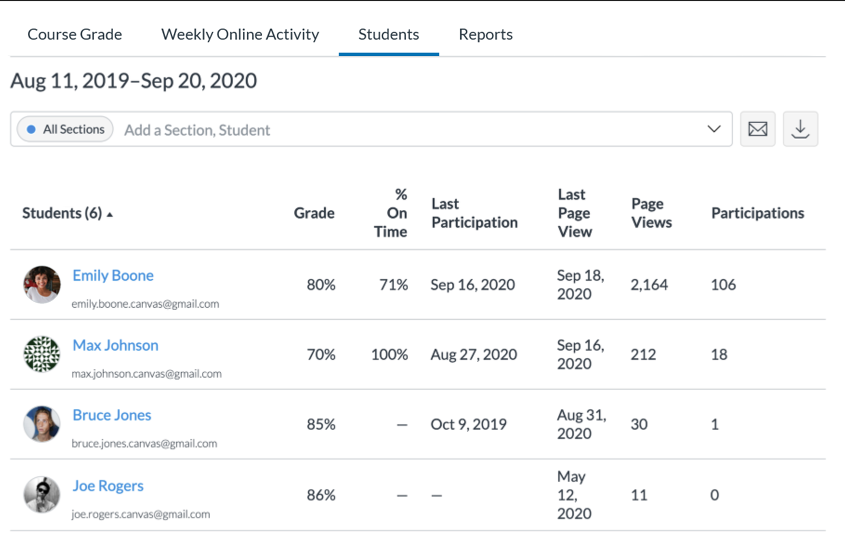
- view individual student progress in comparison to other students
- identify students who may need extra support for their course assessment(s)
- inform decisions to modify and strengthen the alignment of learning outcomes, activities, and assessments
In addition, instructors of funded Blended Learning courses can also review Video Analytics that tracks students’ learning behavior through lecture videos.
- Advanced Learning Hub
- Institutional Learning Technologies
- Active Learning Tools and Proposed Usage
- Large Teaching & Learning Innovation Projects (L-TLIP)
- Blended Learning & MOOC Blended Learning & MOOC
- Teaching and Learning Innovation Projects Teaching and Learning Innovation Projects
- Education and Generative AI Fund Education and Generative AI Fund
- UGC's Strategic Grants
- The Academy of Education Excellence (AEE) The Academy of Education Excellence (AEE)
- HKUST eLearning Strategy
- eLearning Workshops
- New Faculty Program New Faculty Program
- Our Strategic Alliances
- Generative AI & Education Generative AI & Education
- Augmented and Virtual Reality
- Blended Learning Blended Learning
- Graduate Teaching Assistant Program Graduate Teaching Assistant Program
- Experiential Learning
- Teaching and Learning Symposium
- Gamification & Game-based Learning
- Seminars & Workshops
- MOOC MOOC
- Learner-centered Course Design Learner-centered Course Design
- Online Teaching - Real-time Online
- Online Teaching - Mixed Mode Teaching
- People
- News
- Contact Us
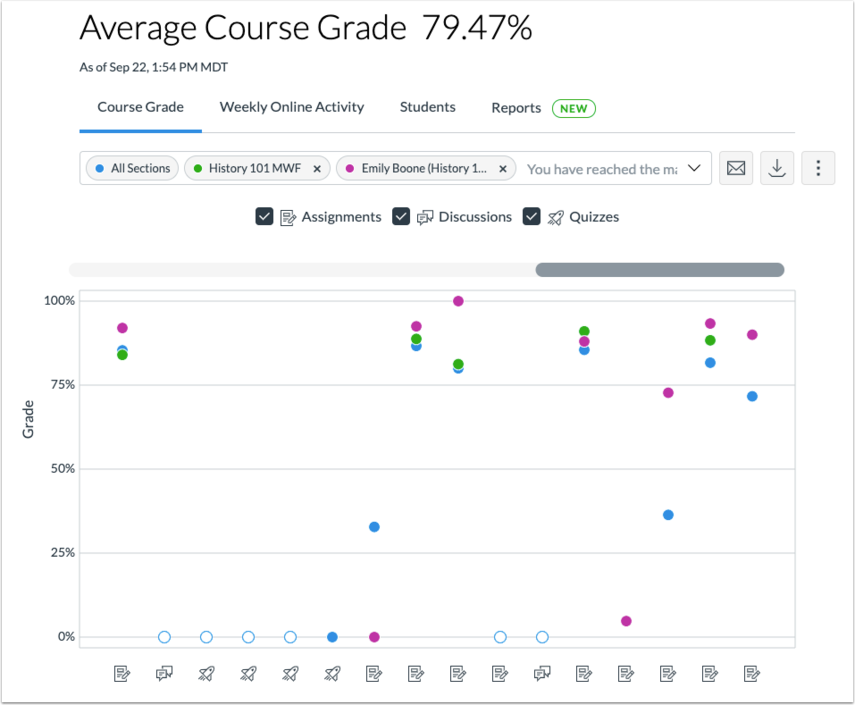
Analytics in Canvas can be accessed from Course Navigation [1] or accessed from the New Analytics icon on the Course Home Page [2].
![Analytics in Canvas can be accessed from Course Navigation [1] or accessed from the New Analytics icon on the Course Home Page [2]](/sites/default/files/content/bl/bl-canvas-new-analytic.png)
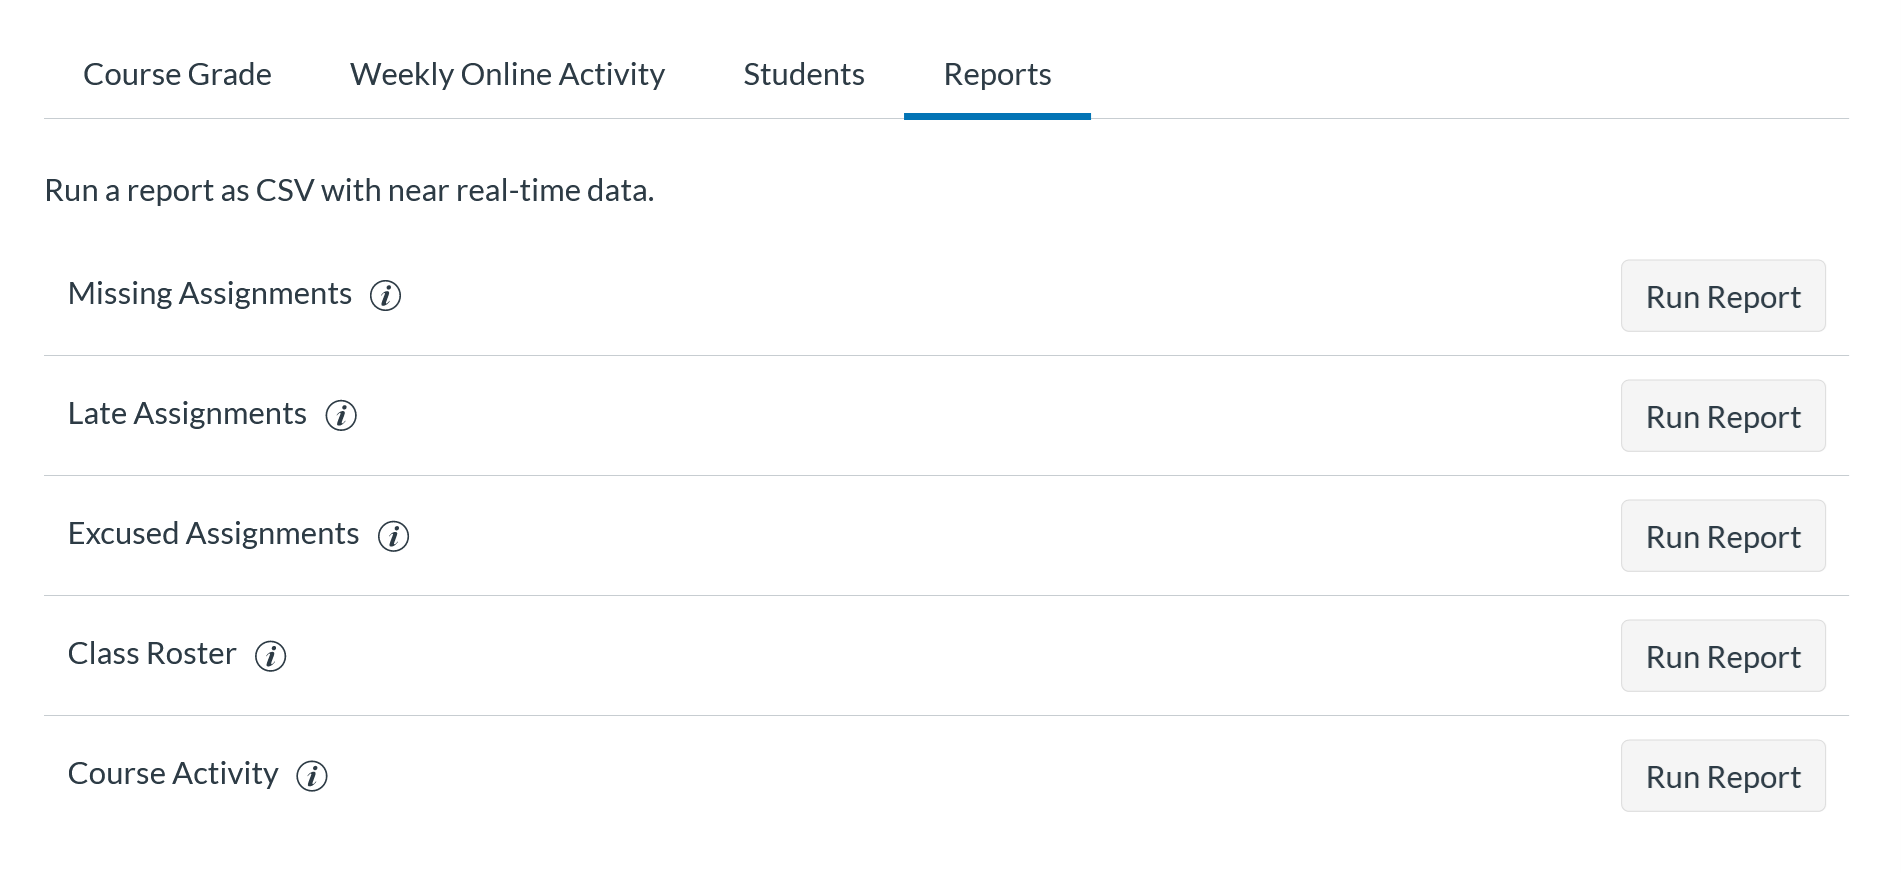
Allows you to view:

Instructors using ITSC video streaming server to store their learning videos will be able to get detailed video analytics reports. The analytics can give you more insights on students' video viewing behavior.
Example Data from Analytics:
Whole class and individual viewing behavior
- Number of total access and date of access
- Most popular access dates and time
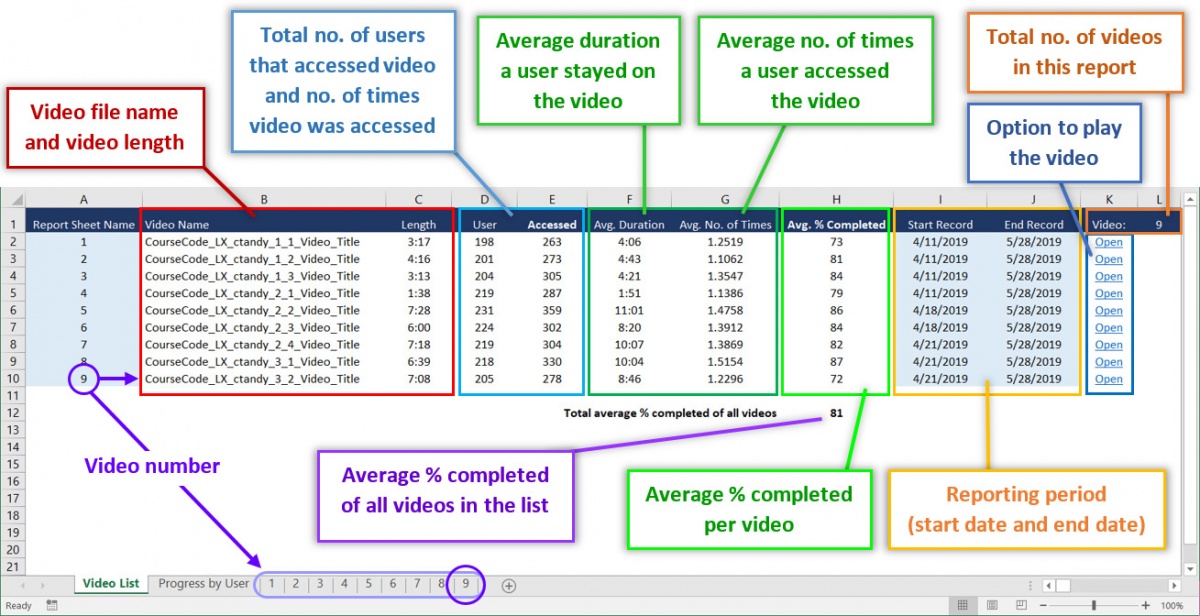
- Percentage completed for each video and all videos in the list
- Average duration watched per video
- Peak areas within a video where more students went back, skipped forward or paused
NOTE: These reports capture data for students who have individually logged in and does not account for students who may be viewing videos in small study groups using only one log-in.
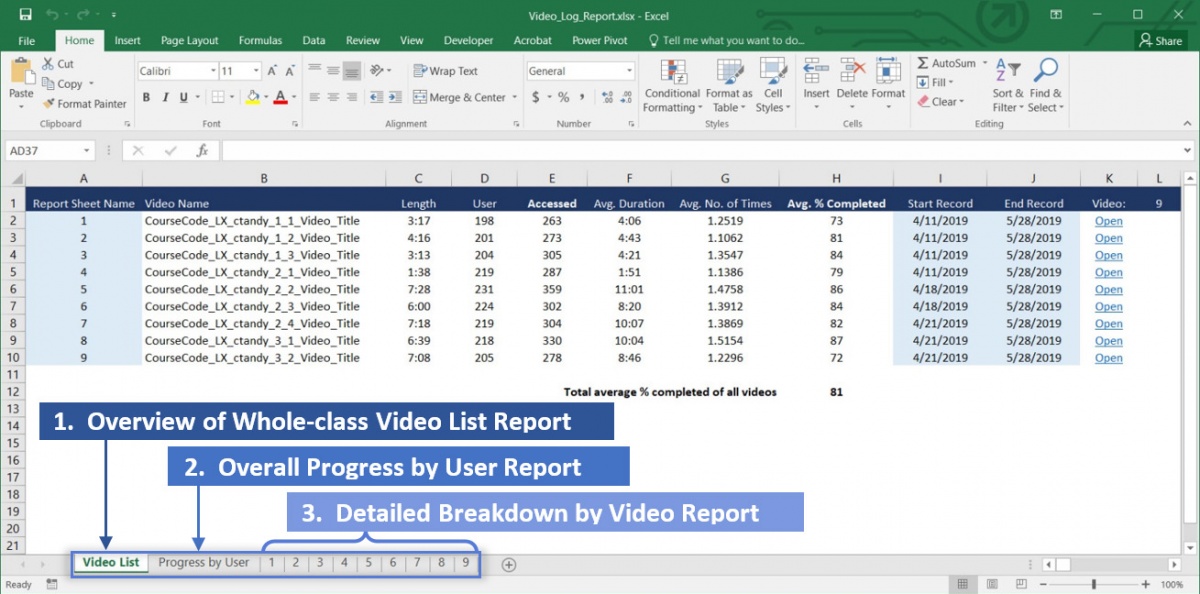
3 Types of Reports
This report lists out all or a selected list of videos for a course and provides an average overview of the total class access. This can give you a general idea of how many students in the class are accessing videos in a particular week.
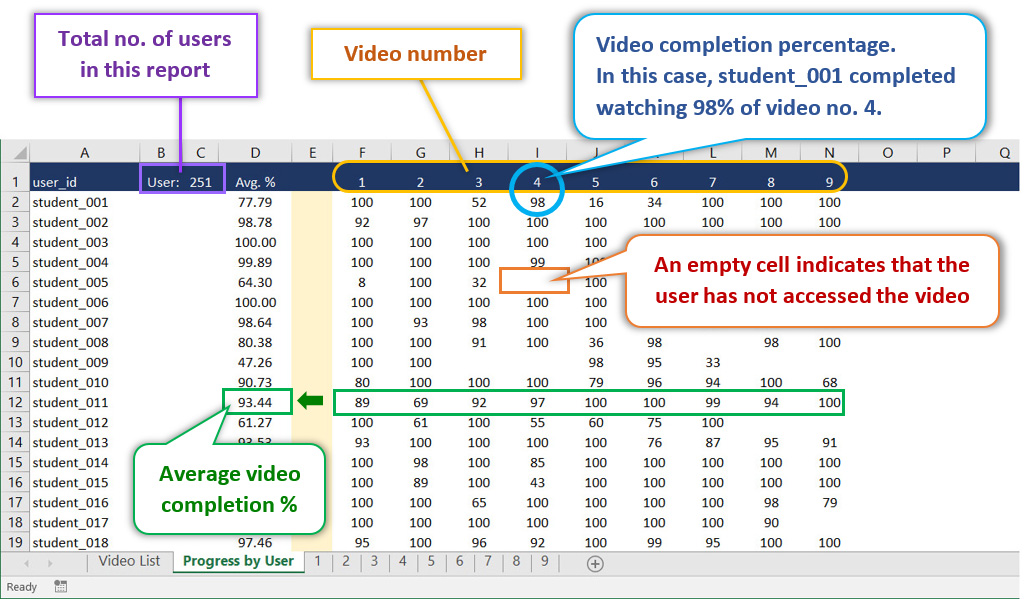
This report lists out the overall progress of individual users and their completion for each video.
How to generate your own Video Analytics Reports?
Our video management system now allows users to generate the video analytics for their own courses. To know more, please watch the video and follow some simple steps. Happy exploring!


